13 Week Three Overview
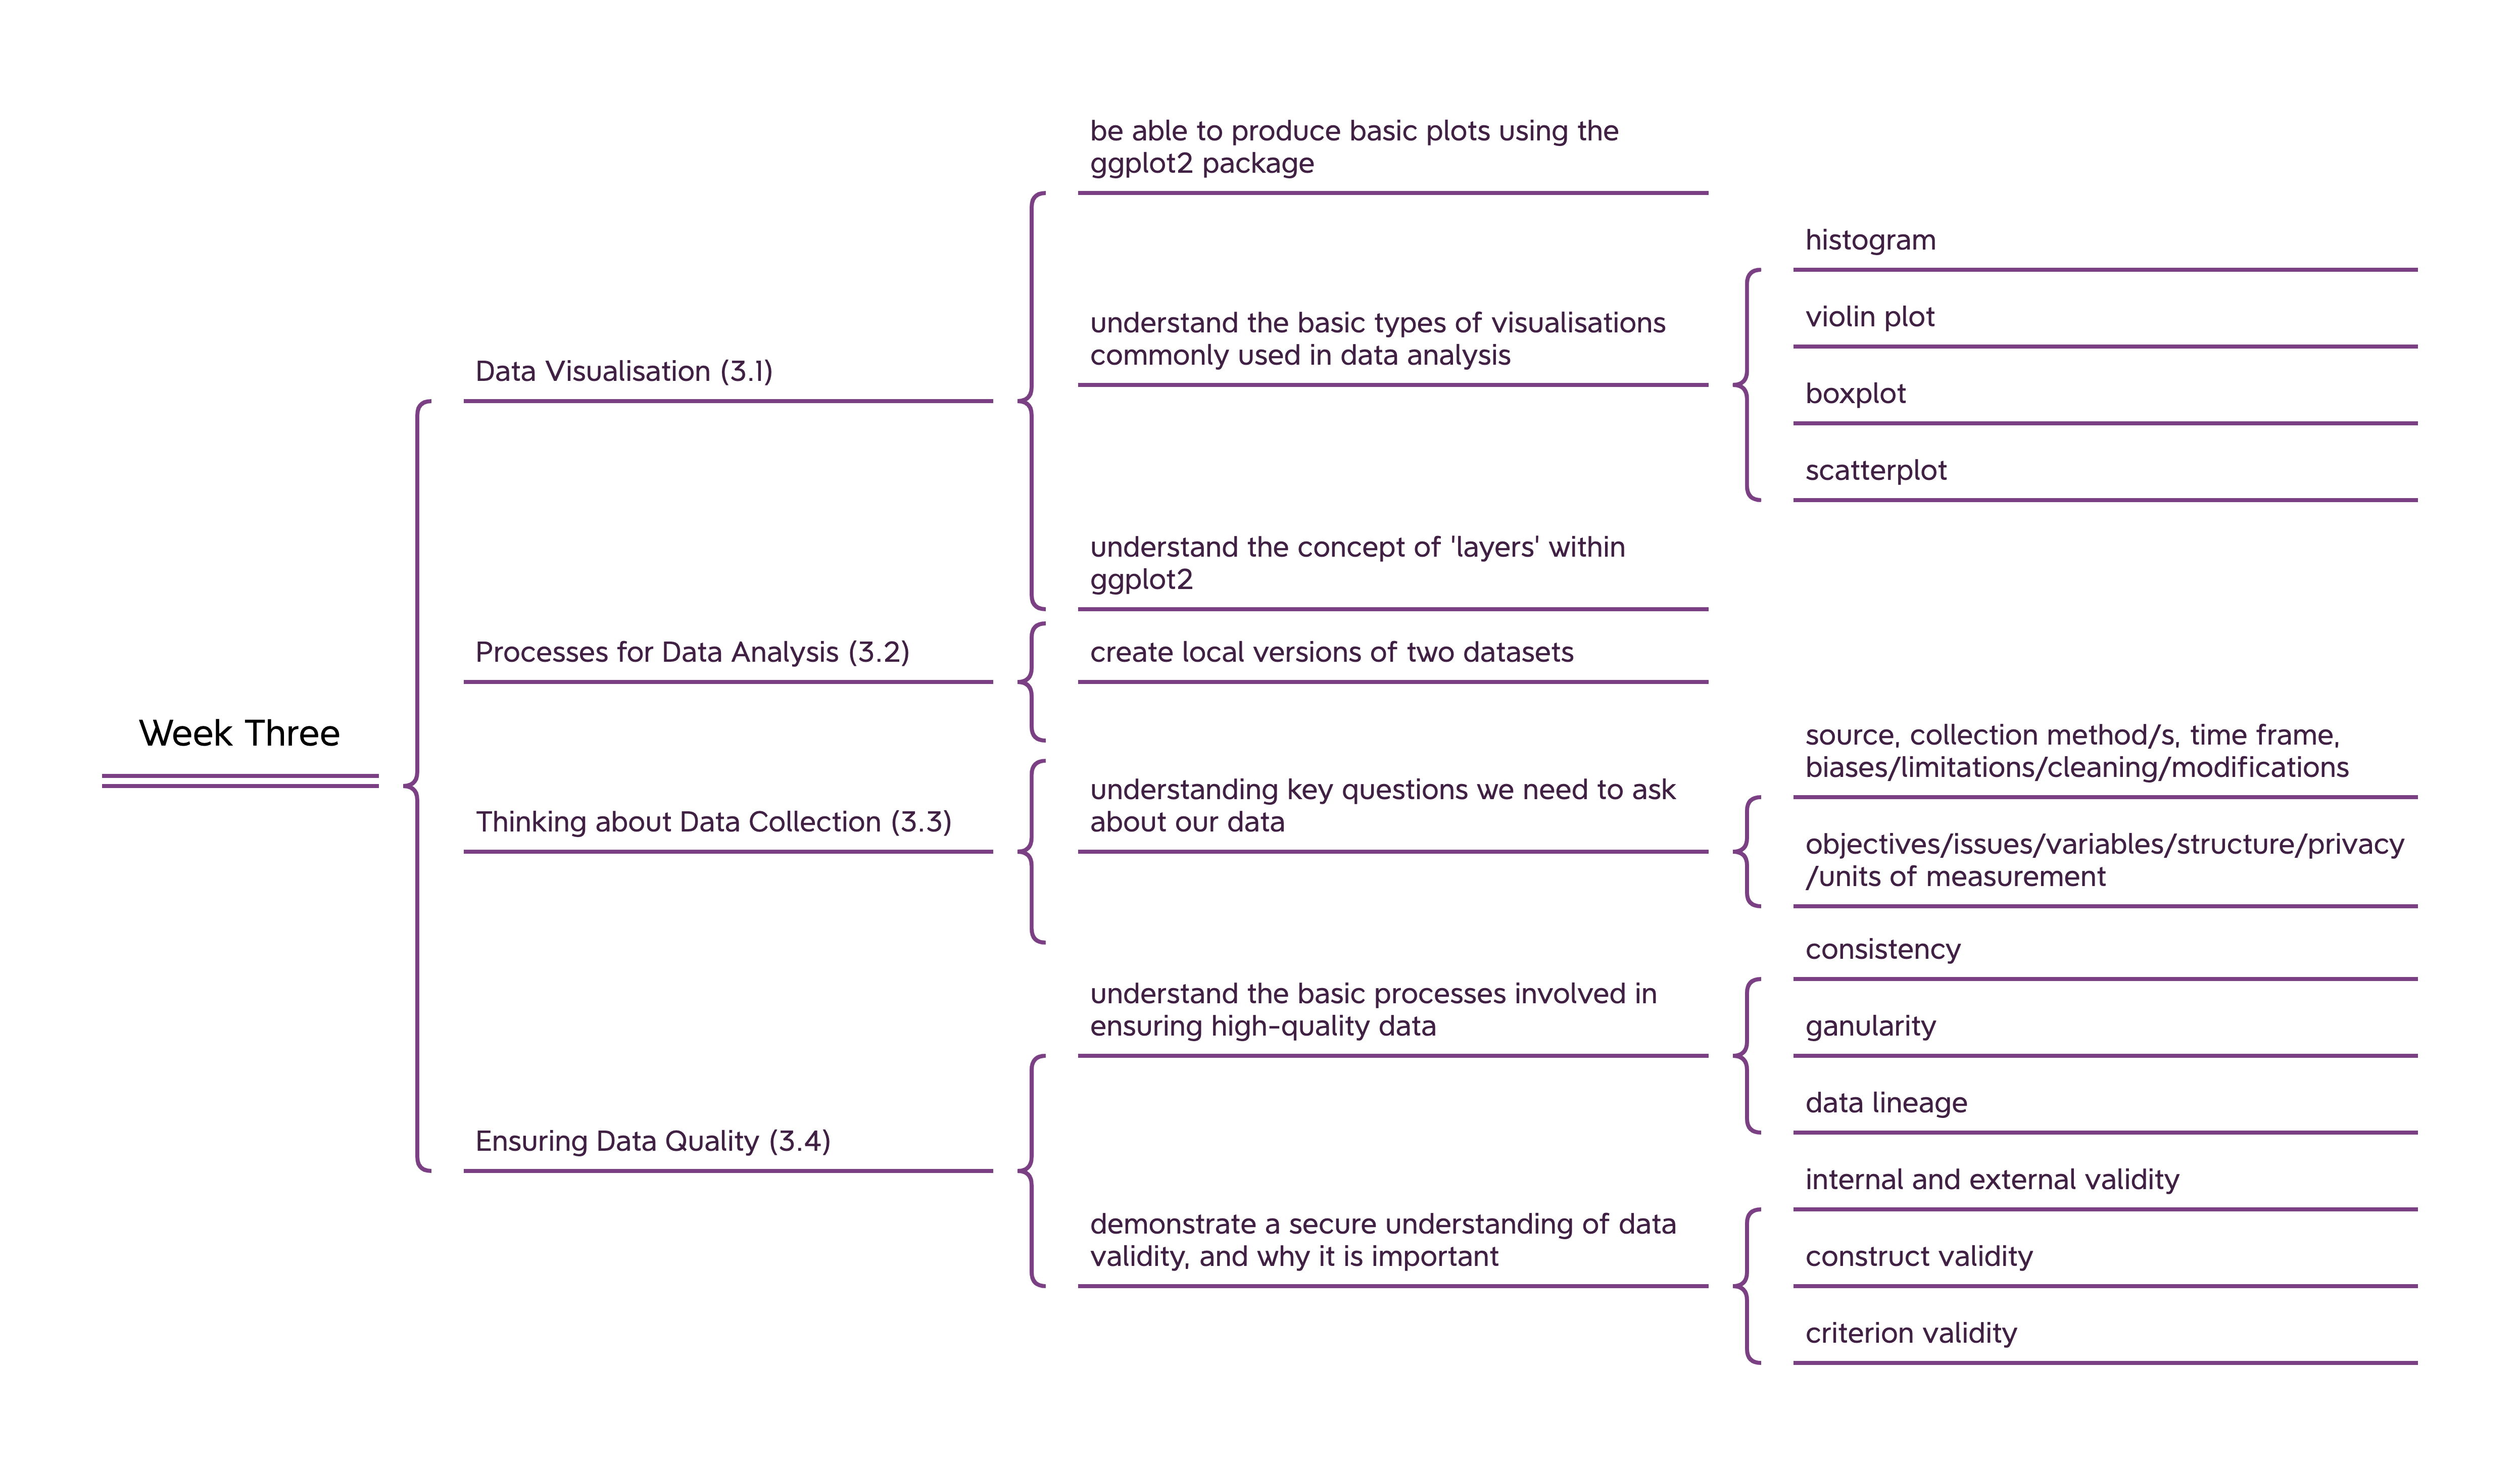
13.1 Data Visualisation (3.1)
On completion, you should:
be able to produce basic plots using the ggplot2 package
understand the basic types of visualisations commonly used in data analysis
histogram
violin plot
boxplot
scatterplot
understand the concept of ‘layers’ within ggplot2
13.2 Processes for Data Analysis (3.2)
On completion, you should:
- be able to create and save local versions of two datasets that you have downloaded
13.3 Thinking about Data Collection (3.3)
On completion, you should:
be aware of the key questions we need to ask about the data you work with
source - where did the data come from?
data collection methods?
time frame?
biases in data collection?
limitations to the data - what’s missing?
how has it been cleaned?
how has it been modified?
what were the objectives of the original data collection?
are there any issues within the data?
what variables make up the dataset?
what is the structure of the data? Is it in a wide/flat format that needs to be addressed?
how have concerns about privacy etc. been addressed?
what units of measurement have been used?
13.4 Ensuring Data Quality (3.4)
On completion, you should:
understand how we ensure high-quality data?
consistency - measurements, naming, measurement scales
granularity - the correct degree of specificity in data
data lineage - keeping track of your data
understand the concept of ‘validity’ in data (and why it matters)?1
internal and external validity
construct validity
criterion validity
The concepts of data validity and reliability will be covered in more detail in the B1704 Research Methods module.↩︎